Customer Service Analytics
Analytical reporting app for service organization KPIs and metrics
Overview
Analytical reporting should help to answer very precise questions over the service organizations:
- Why and how much customers contact us?
- How convenient for the customer to reach the company?
- How quick is the service?
- How high is the quality of interactions?
- How happy are the customers?
- How to plan resources?
- How expensive is the service?
Though CS-metrics are not rocket science, there is often some confusion which KPI represents the service better.
That’s why I wanted to build an example of dashboard that would reflect only useful but comprehensive information.
It is based on the generated static data, but can be easily connected to corporate master data DBs, DWH or separate sources.
🔗 https://cs-dashboard.roboteria.io
Reports Structure
Service Overview
Birdview on the service organization: status of main KPIs
Volumes
Scale and dynamic of customer interactions
📊 Volume Dynamic
Incoming phone calls, emails and chats in timeline.
📊 Volume structure
Analysis of volume structure per channel, language, symptome codes.
📊 Volume Drivers
Details of volume drivers: symptome codes, geography.
Service Levels
How accessible is the service for customers
📊 SLA overview
Analysis of Service Levels, Abandonment Rate and Speed of Answer per channel.
📊 Live Channels Performance
Analysis of hourly patterns for live channels (phone and live chat).
Efficiency
How quick and effient is service (both for customers and organisation)
📊 Resolution
Analysis of first call resolution rate, speed of resolution and derivative metrics.
📊 Productivity
Analysis of average handle time (AHT) and interaction per hour (IPH).
Quality
How high is the quality of interactions - quality control
📊 Quality Assurance
QA-score pass rate and critical errors accuracy analysis per person, channel and symptom code.
Customer Satisfaction
How happy are the customers with the service, product and processes
📊 CSAT
Analysis of customer satisfaction score.
📊 DSAT
Analysis of main dissatisfaction drivers.
Workforce Management
Analysis of WFM metrics and detailed team performance
📊 Workforce metrics
Main WFM metrics analysis: utilization, occupancy, shrinkage.
📊 Team Performance
Aggregate metrics per agent: productivity, quality, wfm.
📊 Agent Score Card
Details of individual metrics per agent.
Economics
How expensive is the service for organization
📊 Costs Overview
Analysis of costs per interaction / ticket / customer.
KPIs & targets
CS targets should reflect the organization’s business needs. Targets here are used purely for demo purposes, but are quite common across different industries.
SLA Metrics
| KPI | Description | Email Target | Phone Target | Chat Target |
|---|---|---|---|---|
| Speed of Answer | Avg. time taken to respond to customer inquiries | < 24 hours | < 60 seconds | < 90 seconds |
| Service Level (SLA) | % of interactions meeting response time target | > 90% | > 80% | > 80% |
| Average Handle Time | Avg. time spent on handling customer interactions | < 8 minutes | < 5 minutes | < 10 minutes |
| Abandonment Rate | % of customers who disconnect before being served by an agent | N/A | < 7% | < 7% |
Efficiency Metrics
| KPI | Description | Target |
|---|---|---|
| Interactions per Hour | Number of customer interactions handled per hour | > 6 |
| Resolution Time | Avg. time from opening a ticket to resolving and closing | < 68 hours |
| Contacts per Case | Avg. number of customer interactions per ticket | < 1.5 |
| First Contact Resolution | % of tickets resolved after first interaction with customer | > 60% |
| Escalation Rate | % of tickets escalated to the 2nd tier of support | < 15% |
| Productivity Index | Index blending speed and quality | > 306 |
Quality Metrics
| KPI | Description | Target |
|---|---|---|
| Customer Satisfaction (CSAT) | Customer Satisfaction score based on post-interaction surveys | > 4.2 |
| QA Score | Avg. quality level: % of points earned on the QA form | > 90% |
| Pass Rate | % of interactions that met QA target | > 85% |
| Critical Accuracy | % of evaluated interactions that contain no critical error | > 100% |
| Sample Size | % of evaluated interactions | > 22% |
Volume & Planning Metrics
| KPI | Description | Target |
|---|---|---|
| Forecast Variance | % delta of forecasted and actual interaction volumes | < 6% |
| Daily Interactions | Avg. number of customer inquiries per day | - |
| Weekly Interactions | Avg. number of customer inquiries per week | - |
| Interactions per Customer | Avg. number of interactions per unique customer | - |
| Tickets per Customer | Avg. number of tickets per unique customer | - |
Workforce Management Metrics
| KPI | Description | Target |
|---|---|---|
| Utilization | % of productive time within paid time | > 90% |
| Occupancy | % of time handling customer inquiries within available time | > 80% |
| Shrinkage | % of unavailable time within paid time | < 20% |
Data & Sources
Data used to demo the dashboards is generated to replicate the real CS-data structure.
You can find more details of the data structure, fields, and generation parameters here:
🔗 https://github.com/PSavvateev/cs-data-generator.git
Dataset tables structure
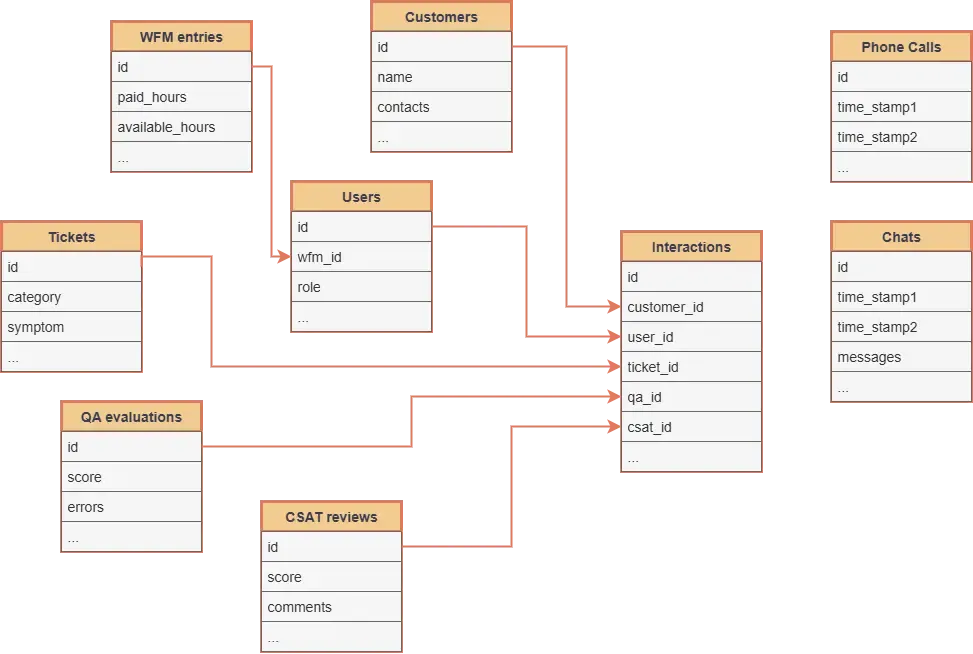
CRM source
Naming can differ in different CRM systems, but in principle there are few key objects:
- Users (with role)
- Customers (with all contact details)
- Tickets (or cases)
- Interactions (recieved emails, handled calls and chats)
Phone ACD source
Technical details and timestamps over all incoming (handled and abandoned) phone calls
Live chats source data
Technical details over chat conversations with timestamps. Can be also integrated to CRM.
HR-system source
Details over employees hours, productve hours, shrinkage and attendance
QA-system source
Often a separate from CRM tool, that allows to conduct quality assurance (with API to CRM fetching tickets and interactions)
Tech Stack
Frontend
- ⚛️ React.js v.18.2.0
- Material UI v7.1.1
- 📊 Apache ECharts v. 6.0.0
Backend
- 🐍 Python v3.12
- 🐼 Pandas
- 🚀 Fast API