Tickets Backlog Handling
Tactic to resolve and prevent customers tickets backlog.

Context
A B2B payments company faces a critical ticket backlog crisis following the onboarding of a large merchant that generated 55% more customer inquiries than anticipated. Without intervention, the backlog will grow by 15% weekly, risking customer churn and SLA penalties.
Goal
- Resolve backlog issue
- Prevent gaining backlog in the future
Key input
| Metric | Details |
|---|---|
| Current staffing | 6 FTEs |
| Service window | Monday–Friday, 9:00 – 18:00 |
| Service channel | Deferred only (webform, emails) |
| Language support | Not language-specific |
| Daily incoming volume | 310 emails |
| Monthly service budget | € 27,600 |
| SLA target | 90% in 24 hours |
| AHT target | 8 min |
| Utilization target | 85% |
| Unplanned shrinkage target | 7% |
| CSAT target | 4.0 |
Analysis
For this case, I focused more heavily on data preparation, to demonstrate how proper analysis of current situation suggests the action plan.
CS KPIs dashboard
Here you can find analytical report with all simulated data for this case:
🔗 backlog-demo.netlify.app
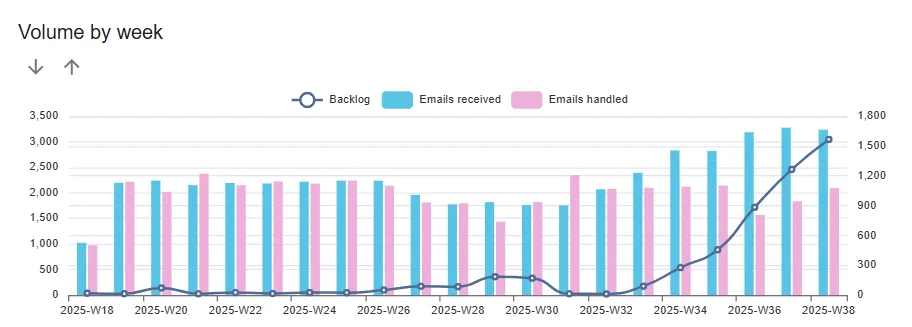
The dashboard represents few relevant KPIs for the analysis:
- Backlog behavior: static handling capability vs. growing incoming volume
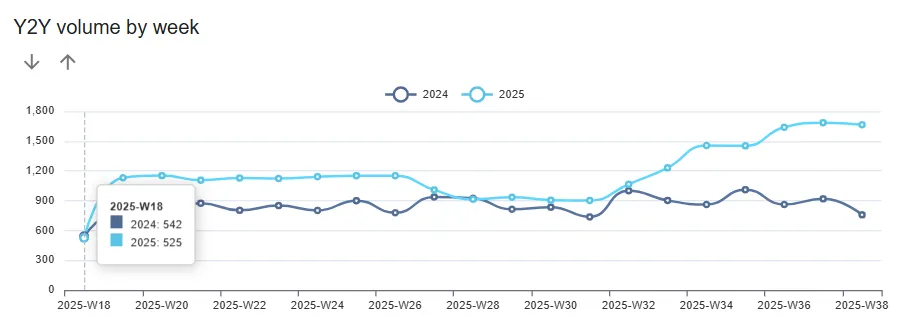
- Year-to-year comparison help to identify seasonal peaks
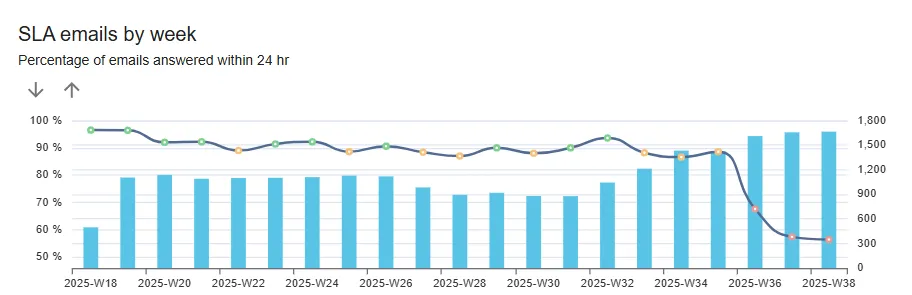
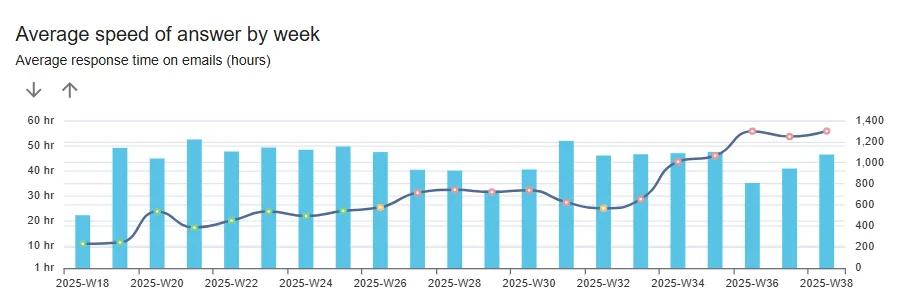
- SLA / Speed of Answer behavior: key symptoms of service deterioration
- Efficiency metrics - important to identify if there is any room for extra capacity
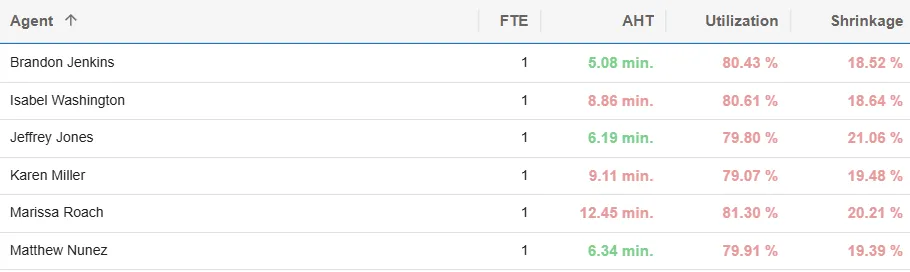
- Average handle time (AHT): large variance between agents
- Utilization: 20% of productive time out of the queue (not handeling customer interactions)
- Shrinkage (unplanned): unavailable time (breaks, absences, sickness, etc.)
Current status
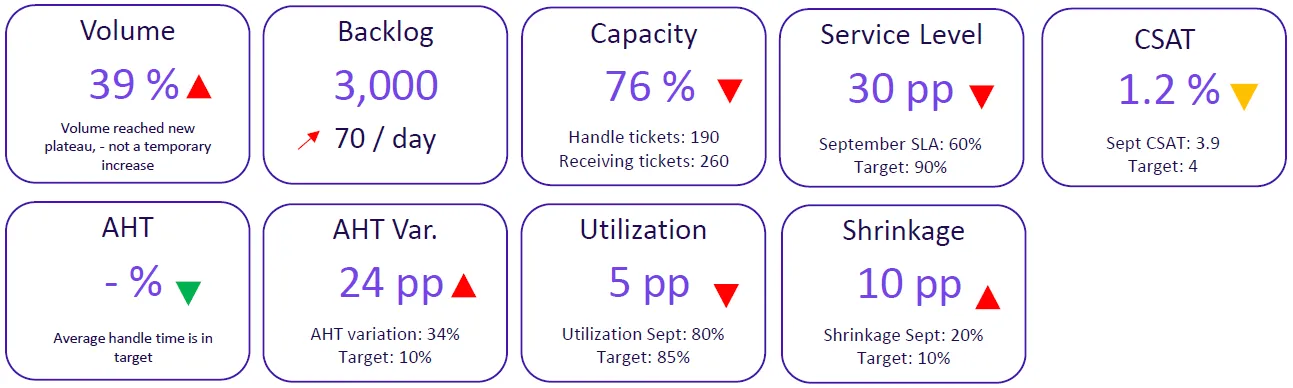
To summarize the data, there are a few critical points:
- accessibility and speed of service is challenged;
- volume increase appears permanent;
- 24% gap in capacity;
- opportunities to improve efficiency.
Conclusion
Resources are not adequate to the new volume plateau:
- insufficient staffing;
- low efficiency.
Actions
Desired destination
Symptoms of sustainable no-backlog service:
- SLA in target
- AHT in target
- WFM metrics in target
- Volume forecast high accuracy
- Long-term staffing plan
Risks
| Risk | Level | Associated costs |
|---|---|---|
| Customer’s (buyers and merchants churn) | HIGH | Lost of revenue, opportunity costs |
| SLA penalties (merchant contract) | MEDIUM | Direct monthly fee – lost of revenue |
| Agents’ attrition | MEDIUM | Hiring / onboarding costs |
| Permanent ramp-up | Payroll, overheads |
Plan
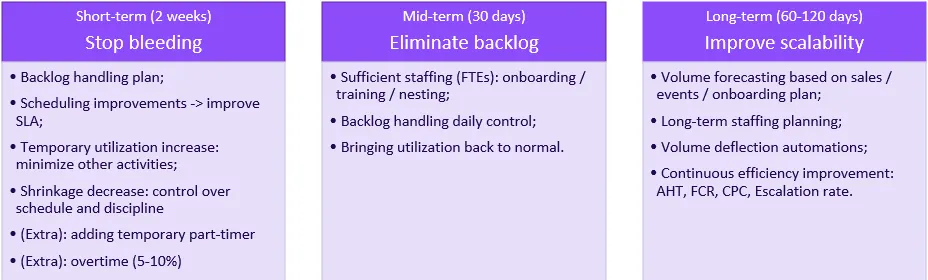
Action plan contains three phases.
- First phase - urgent low fruits actions to stop gaining backlog.
It includes planning, scheduling improvements, suspending any non-essential activities. Sometimes you can afford overtime or part-timers. - Second phase - permanently increasing capacity and extra care to handle the backlog.
After the second phase, the position is stable but still fragile, because any unexpected volume pick can bring you back and you cannot do phase 1 exercises too often - it will ruin the team. - Third phase - is about scalability and prevention.
The bottom line is to have clear expectations of the volume, planned budget for ramp-ups and continuous efficiency improvement.
Backlog handling
Method
According to COPC© methodology, tickets backlog should be handled using FIFO (first in first out) method.
Some pre-work may be useful:
- Tickets merging: combine duplicate inquiries from same customer;
- Tickets segmentation: prioritize some categories by urgency/value.
Planning
Here you can see projection of the backlog behavior by taken different actions. Those are not scenarios to choose from, but for comparison.
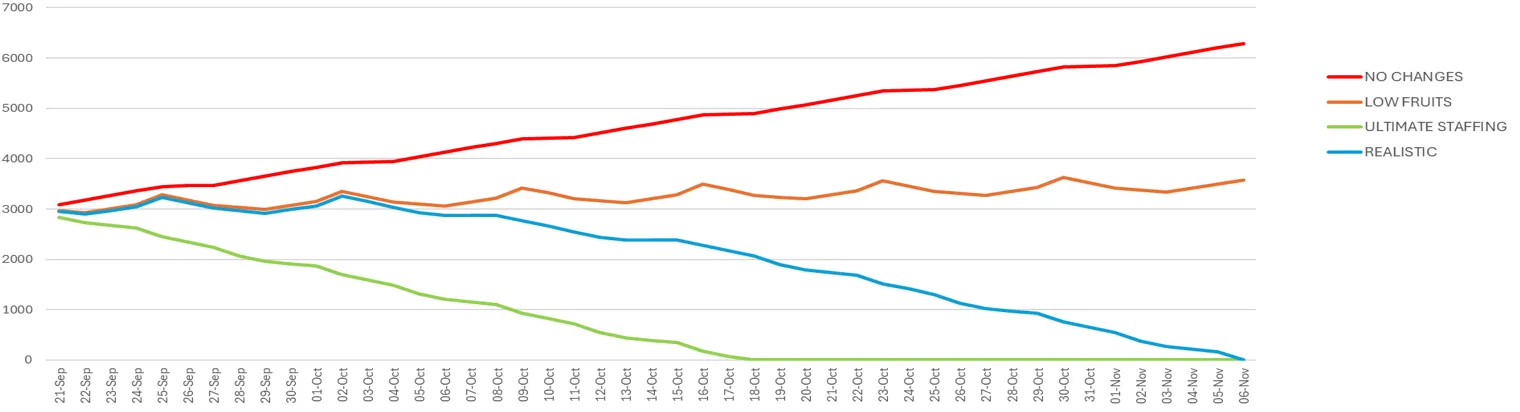
- Red line - natural backlog growing, if no actions taken.
- Yellow line - is quite remarkable - it shows that only by taking urgent efficiency improvement actions we can stop backlog from growing. Because 6 FTEs though are not sustainable but adequate for 300 emails daily.
- Green line - extreme example of quick solution when you have trained extra staff available.
- Blue line is backlog handling according to the proposed plan. It is more realistic, considering new agents onboarding and some efficiency gaps associated with it.
| Scenario | Actions | Weekly backlog Δ | Backlog clear time | Investment | Risk |
|---|---|---|---|---|---|
| Scenario #1: No change | No actions | +470 | never | 0 | Critical |
| Scenario #2: Low fruits | - Scheduling improvement - Utilization increase to 97% - AHT improvement 12% (to 7 min) - Shrinkage decrease to 10% | +0 | never | Manag. costs increase: 10%* | Critical |
| Scenario #3: Urgent staffing | - All actions from Scenario #2 - Sufficient staffing from day 1 | -700 | 4 weeks | - Manag. costs increase: 20%* - Annual budget increase 7.5% | Low |
| Scenario #4: Realistic | - All actions from Scenario #2 - Adding 1.5 FTE since week 2 - Lower efficiency of new hires (week 3-4) | -340 | 4 weeks | - Manag. costs increase: 10%* - Annual budget increase 6% | Medium |
*percentage of total monthly budget during backlog handling period
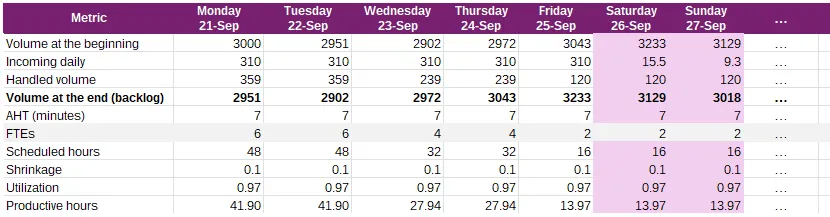
Planning table example
Staffing
There are three main elements of capacity planning:
- Required hours are calculated based on expectedvolume, expected productivity and expected WFM metrics;
- Scheduling and coverage;
- Hiring / onboarding lead time.
Calculation methodology
You can calculate staffing with this app: 🔗 staffing calculator
Recommended staffing
Current: 6.0 FTEs
Required: 7.5 FTEs
Gap: 1.5 FTEs
Recommendation:
- Since week 1: weekend coverage schedule (temporary)
- Since week 2: Add 2 part-timers (0.75 FTE * 2)
- New hires: 2-week training / onboarding
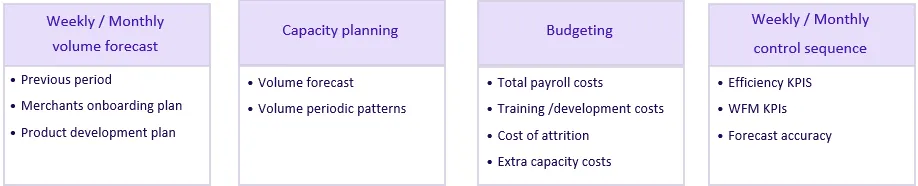
Planning & controlling methodology
Financial impact
Current year budget increase: 6% (+ €19,657)
Next year budget increase: 17% (+ €56,561)
Current annual service budget
| Position | FTEs | Hourly rate | Monthly hours | 2025 annual budget |
|---|---|---|---|---|
| L1 Agent | 6 | € 18.00 | 911 | € 196,732.80 |
| Sr. Agent | 1 | € 22.00 | 152 | € 40,075.20 |
| Team Lead | 1 | € 28.00 | 152 | € 51,004.80 |
| Overheads | € 43,171.92 | |||
| Total | € 330,984.72 |
New annual service budget
- ramp up in September: 1.5 FTE
- overheads temporary increase: up to 20%
| Position | FTEs | FTEs since 21/09 | Hourly rate | Monthly hours | 2025 annual budget |
|---|---|---|---|---|---|
| L1 Agent | 6 | 7.5 | € 18.00 | 978 | € 211,312.80 |
| Sr. Agent | 1 | 1 | € 22.00 | 152 | € 40,075.20 |
| Team Lead | 1 | 1 | € 28.00 | 152 | € 51,004.80 |
| Overheads | € 48,249.00 | ||||
| Total | € 350,641.80 |
Next year estimated service budget
| Position | FTEs | Hourly rate | Monthly hours | 2026 annual budget |
|---|---|---|---|---|
| L1 Agent | 7.5 | € 18.00 | 1138 | € 245,916.00 |
| Sr. Agent | 1 | € 22.00 | 152 | € 40,075.20 |
| Team Lead | 1 | € 28.00 | 152 | € 51,004.80 |
| Overheads | € 50,549.40 | |||
| Total | € 387,545.40 |
Conclusion
My goal was to combine realistic efforts in a tight budget and fairly moderate risks.
It is quite universal approach that can deviate by applying different variables.
This case suggests a three-phase action plan to eliminate the backlog within 6 weeks while building sustainable capacity.
The recommended approach combines immediate efficiency improvements (scheduling optimization, utilization increase to 97%) with strategic staffing additions (1.5 FTEs), requiring a modest 6% annual budget increase.
Week 1-2: Implement low fruits + weekend coverage
Week 3-4: Onboard 1.5 additional FTEs (2 x 0.75)
Week 5-6: Backlog eliminated, normalize operations
Week 7+: Focus on automation & efficiency investment
Current year budget increase: 6%
Next year budget increase: 17%
Backlog resolution: 6 weeks
Risk mitigation: medium to low